
10 June 2026
Poorest families with children need to spend 85% of their disposable income to afford a healthy diet

Poorest families with children need to spend 85% of their disposable income for a healthy diet. Price gap between healthier and less healthy food at its widest in over a decade
The Food Foundation's annual Broken Plate report has found:
- Households with children in the lowest income fifth of the population would have to spend a staggering 85% of their disposable income to afford the government recommended healthy diet, up from 70% in 2024, showing a healthy diet has now become unachievable for millions of UK families(1)
- The price gap between healthier and less healthy food is increasing and is now the widest it has been in over a decade(2)
- Healthier food is nearly twice as expensive per calorie as less healthy, with foods high in fat, salt and/or sugar alarmingly being the only food group to have seen a drop in price in the last year
- Fast-food outlets make up 1 in 4 places to buy food in England, rising to over 1 in 3 in the most deprived areas(3)
- 40% of food and non-alcoholic drink promotions are on foods high in fat, salt and/or sugar(4)
- Fruit and vegetables only account for 3% of traditional advertising food and non-alcoholic drink expenditure(5)
The Food Foundation’s flagship Broken Plate report, funded by Nuffield Foundation, uses a range of metrics to build a snapshot of the UK food system.
This year's report demonstrates worsening health and diet inequalities in the UK where the most deprived households, particularly those with children, are priced out of a healthy diet that would protect their wellbeing and reduce pressure on the NHS. This is particularly concerning at a time when food prices are predicted to rise further in the coming months.
Cost of healthy food
Households in the lowest income fifth of the UK population would need to spend 49% of their disposable income to afford the government recommended healthy diet, known as the Eatwell Guide, (a four percentage point increase since 2024, and compared to just 11% of disposable income for households in the highest income fifth).
This increases to a staggering 85% for households with children in the lowest income fifth (a 15 percentage point increase since 2024), making a healthy diet out of reach for millions. The data was gathered in 2025, before the War in the Middle East led to predictions of an upcoming further spike in food prices, and adds to ongoing concerns that climate shocks could increasingly impact crop yields and food prices.
The Broken Plate report also found that healthier food, per calorie, is nearly twice as expensive as less healthy food and the gap is growing. The cost of both rose during the period of high food price inflation between 2021 and 2023. However, since 2023 the price of healthier food continued to increase, and the price of less healthy food stabilised, and even slightly declined in the last year. The price gap between healthier and less healthy food is now the widest it has been in over a decade, with a 27% increase in the price gap between healthier and less healthy food from 2015 to 2025.
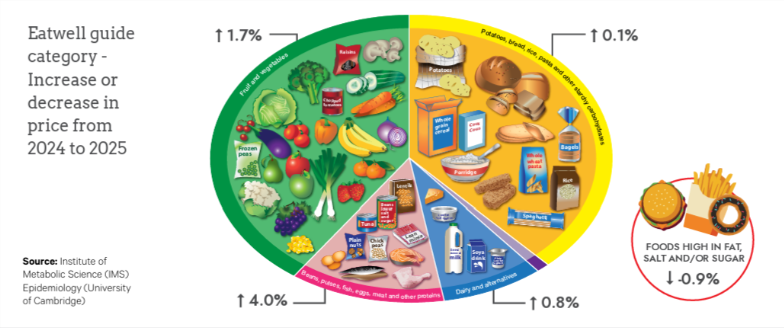
Alarmingly, food and drinks that are high in fat, salt and/or sugar are the only food group to decrease in price from 2024 to 2025. Protein foods saw the largest annual increase in price at 4%, followed by fruit and vegetables at 1.7%.
Availability and promotion
Within this context, it is disheartening to see that foods high in fat, salt and/or sugar are disproportionately available, promoted and advertised, and sold at relatively cheap prices, while staples and fruit and vegetables are overlooked.
The report shows that fast-food outlets make up one in four places to buy food in England, rising to over one in three in the most deprived areas, 40% of food and non-alcoholic drink promotions are on foods high in fat, salt and/or sugar, and fruit and vegetables only account for 3% of traditional advertising food and non-alcoholic drink expenditure.
Policymakers need to tighten regulation and reduce loopholes to ensure members of the public, working with tight budgets, aren’t set up to fail by a food system that is flooded with cheap junk food.(6)
Diets lacking in nutrients and poor health outcomes
The report highlights that only one in 10 11-18 year olds eat five portions of fruit and vegetables a day, while 95% consume above recommended levels of free sugar(7). People in the most deprived groups are more than twice as likely to have diets lacking three or more key micronutrients compared to those in the least deprived groups(8).
Data collected from a range of sources also shows that in an average English Reception class of 30 children, three will be living with obesity. In Year 6, this more than doubles to seven children(9). In reception, children in the most deprived group are nearly twice as likely to develop obesity than those in the least deprived group.
Ten-year-olds from the most deprived backgrounds are over 1.5 times more likely to have short stature(10), and more than one in five five-year-olds in England have tooth decay, rising to more than one in three in the most deprived areas(11). Healthy life expectancy is also at its lowest level since 2013–15, with a nearly 20-year gap between the least and most deprived areas(12).
To address these issues, The Food Foundation is calling for urgent action, including:
- Rapid introduction of the prevention commitments in the government’s NHS 10 Year Health Plan, such as mandatory reporting of healthy sales for big businesses, without further delay
- A support package for low - income families to afford healthy and sustainable food, including expansion of Healthy Start, as part of the response to cost-of-living pressures
- Introducing a Good Food Bill to provide long - term nutritional security and protection for citizens and farmers alike
Anna Taylor, Executive Director of The Food Foundation, said: "The Broken Plate report reveals that it is becoming increasingly difficult for struggling families to afford and access a healthy diet, despite promises from the Government to create the healthiest generation of children ever and reduce child poverty. This isn’t good enough.
"The government must press ahead with its commitments made in the 10-Year Plan, including the mandatory reporting of healthy sales by food businesses. Recent reports implied the government is considering delays to the health measures it promised only a year ago.
"This would be a grave mistake given the state of the UK’s food system, and the poor health suffered by its citizens. The government must take bold action now to fulfil its promises and ensure everyone can access the healthy and sustainable diet they deserve."
Lynn Perry, Chief Executive of Barnardo’s said: "The food we eat during childhood has a significant impact. Yet in the UK, too many children and young people are missing out on nutritious meals, with serious consequences for their health both now and later in life.
"We know parents are making major sacrifices to ensure their children can eat as well as possible within their budgets. However, with the cost of everyday essentials remaining persistently high, healthy food is still out of reach for many families – and those living in poverty often face greater challenges in buying, preparing and accessing good food.
"With prices rising, we call on government to make sure that all children receive the nutrition they need regardless of their circumstances."
Katie Schmuecker, principal policy adviser at Joseph Rowntree Foundation, said: "At JRF, we know there is a gulf between what people can afford and what they need, one that risks getting wider in the coming months.
"But the Food Foundation's shocking finding that a healthy diet takes up 85% of disposable income for the worst-off families throws the challenge into sharp focus. This is why we need Universal Credit to be linked to a calculation of essential costs, such as food, so every family can afford life's essentials."
Professor Ian Sinha, consultant paediatrician from Liverpool, said; "This report once again highlights the worsening accessibility of healthy food to groups already at risk of poor health.
"This is a sad indictment of our system - that we are limiting choice to the extent that nutrition in huge portions of our population is literally driving disease, causing preventable early mortality, and further stretching our health services which are already on their knees.
"This time the government and key policy makers need to heed the warnings before we spiral further. Poor nutrition is fatal, and when we have structural failings which exacerbate the issue, it's high time we fixed the problems at their source."
FOOTNOTES:
(1) The analysis used the Households Below Average Income (HBAI) dataset alongside an updated estimate of the cost of following the Eatwell Guide to calculate the share of household disposable income (after housing costs) required across income quintiles. The Eatwell cost was modelled using an expanded food price dataset and rose from £7.48 per adult per day in 2022 to £9.53 in 2025 after adjusting for food inflation. A secondary analysis of the Family Resources Survey applied the McClements equivalence scale to account for household composition and economies of scale. Disposable income was defined as income after taxes and housing costs, including earnings, benefits, and pensions. The study then assessed affordability across income quintiles and compared households with and without children. The methodology differs from earlier Broken Plate reports (2019–2021), meaning results are not directly comparable.
(2) The Institute of Metabolic Science (IMS) Epidemiology at the University of Cambridge updated earlier food price research by linking Consumer Price Index data from the Office for National Statistics (2014–2025) with dietary data from the National Diet and Nutrition Survey. Prices were calculated per 1,000 kilocalories for each item across quarterly and annual averages, allowing for meaningful comparison of foods within overall diets rather than by individual product categories. Items were classified as “more healthy” or “less healthy” using the Food Standards Agency’s nutrient profiling model, and outliers were excluded from the analysis.
(3) Data on food outlets by local authority were taken from Ordnance Survey’s Points of Interest (OS POI) dataset (June 2025), one of the most comprehensive sources of food outlet locations in England. Fast-food outlets were defined as takeaway outlets, delivery services, fish and chip shops, and bakeries, and used as a proxy for unhealthy food outlets. The proportion of fast-food outlets relative to all food outlets was calculated for each local authority, consistent with previous Broken Plate reports. Local authorities were grouped into deprivation quintiles using the Index of Multiple Deprivation (IMD) 2025, and the average fast-food outlet density was calculated for each quintile.
(4) The Food Foundation, in collaboration with the Questionmark Foundation, analysed multibuy and price reduction promotions across six major UK supermarket websites (Asda, Iceland, Morrisons, Sainsbury’s, Coop, and Tesco) over 17–22 November 2025. A total of 22,321 promotions covering 19,848 products were identified, with price reductions prioritised where products had multiple offers. Nutritional data were scraped for each product and assessed using the UK Government’s 2004 Nutrient Profiling Model (NPM) to classify items as HFSS (foods scoring ≥4 points and drinks ≥1 point). Products with missing nutritional data were categorised as “unknown,” while non-food items, alcohol, and baby/toddler foods were excluded. The analysis calculated the proportion of HFSS and non- HFSS products within different promotion types, with additional screening for sweeteners and emulsifiers based on NHS and FSA-approved lists, with a few additions.
(5) Nielsen provides data on advertising expenditure across all media channels, which is widely used by advertisers and broadcasters to inform media buying decisions. Data covered August 2024–July 2025). The dataset included advertising spend across 240 food and non-alcoholic drink categories spanning seven traditional media channels (TV, radio, press, outdoor, cinema, direct mail, and door drops). These categories were then mapped onto Eatwell Guide categories, although some products (such as ready meals) could not be directly mapped, and were put in a ‘mixed’ category.
(6) In October 2025 the government introduced restrictions on volume-price promotions on 13 categories of food known to contribute high amounts of sugar to children’s diets. This means that offers such as BOGOFs and 3-for-2 offers are no longer permitted on HFSS foods within those 13 categories; however, price reduction promotions and volume promotions on HFSS foods in other categories are still permitted.
(7) This metric uses NDNS survey waves 12–15 (20192023) and includes participants aged 1.5–18 years only. Individuals with missing dietary data were excluded, and analyses are weighted to account for the NDNS survey design to ensure population representativeness. Nutrient intakes are reported as average daily “usual intake” per person, in line with NDNS methodology. Fruit and vegetable intake is measured in 80g portions using the 5-a-day metric and is calculated only for children aged 11 years and over. Other measures include AOAC fibre (g/ day), saturated fat as a percentage of total energy intake (excluding alcohol), and free sugars as a percentage of total energy intake (excluding alcohol).
(8) This metric uses NDNS survey waves 12–15 (2019–2023), with participants missing dietary data excluded. Analyses are weighted to account for the NDNS survey design to ensure population representativeness. Nutrient intakes are reported as average daily “usual intake” per person, following the NDNS methodology. The Lower Reference Nutrient Intake (LRNI) is used as a benchmark for inadequacy, representing the level of intake sufficient for only 2.5% of the population; individuals consuming below the LRNI are therefore likely to have inadequate nutrient intake.
(9) The Child Measurement Programmes are annual surveillance systems measuring children’s weight across the UK. Data used covers Reception children (4–5 years) and uses the 2019 Index of Multiple Deprivation (IMD) based on school postcode, with statistical weighting applied in 2020/21 due to Covid-19 disruption. The Food Foundation averages the two most deprived deciles to estimate quintile outcomes for England. In Wales, data cover ages 4–5 but are incomplete in several years due to the pandemic, with deprivation measured using WIMD based on home postcode. In Scotland, data covers Primary 1 children (4.5–6.25 years) and are broadly comparable over time, using SIMD-based deprivation measures and epidemiological BMI definitions. Northern Ireland is excluded as it uses different definitions of overweight and obesity, making results non-comparable.
(10) The data focus on England only, as this provides the most complete dataset for measuring child growth outcomes. It covers children in Reception (ages 4–5) and Year 6 (ages 10–11). Due to Covid-19 disruptions, fewer children were measured in 2020/21, so statistical weighting was applied to ensure estimates of underweight, healthy weight, overweight, obesity, and severe obesity are nationally representative and comparable over time. Deprivation is measured using the 2019 IMD, based on the postcode of each child’s school.
(11) The data are taken from the sixth National Dental Epidemiology Programme survey of Reception-aged children (4–5 years) in England (2024), conducted by the Office for Health Improvement and Disparities using data collected during the 2023/24 school year. Deprivation is measured using 2019 IMD scores based on participants’ home postcodes, with weighting applied to reflect the population distribution across deprivation quintiles. Outcomes are reported as the percentage of children with dentinal decay (D3MFT>0). Hospital-based tooth extraction data for 0–19-year-olds are drawn from NHS Digital Hospital Episode Statistics (HES), specifically Admitted Patient Care records covering inpatient and daycase activity in NHS hospitals. Each record represents a finished consultant episode under a single clinician. The data are presented as published by the UK Government, with no additional analysis by the Food Foundation.
(12) Healthy life expectancy data are sourced from the Office for National Statistics (ONS), with no additional analysis conducted by the Food Foundation. Estimates are based on the Annual Population Survey (APS), combined with health state prevalence data from the 2011, 2021 (England, Wales and Northern Ireland) and 2022 (Scotland) censuses. Because data are not routinely collected for those under 16 and are limited for those aged 85 and over, the method uses imputation and modelling. Healthy life expectancy is calculated as a period estimate using a Sullivan life table approach, which partitions total life expectancy into years spent in “good” and “not good” health across age groups.
NOTES TO EDITORS:
Please contact: Juliet Grant, Senior Communications Manager, The Food Foundation, on 07929 075489 or email juliet.grant@foodfoundation.org.uk
AVAILABLE FOR INTERVIEW
Anna Taylor, Executive Director, The Food Foundation
Dr Hannah Brinsden, Head of Policy and Advocacy, The Food Foundation
SOCIAL MEDIA
Twitter: @Food_Foundation
Instagram: food.foundation
LinkedIn: The Food Foundation
Bluesky: The Food Foundation
TikTok: thefoodfoundation
YouTube: @foodfoundation91
About The Food Foundation
The Food Foundation is a charity working to influence food policy and business practice, shaping a sustainable food system which makes healthy diets affordable and accessible for all. We work in partnership with researchers, campaigners, community bodies, industry, investors, government and citizens to galvanise the UK’s diverse agents of change, using surprising and inventive ideas to drive fundamental shifts in our food system. These efforts are based on the continual re-evaluation of opportunities for action, building and synthesising strong evidence, convening powerful coalitions, harnessing citizens’ voices and delivering impactful communications.
Registered Charity Number 1187611.
WITH THANKS TO OUR FUNDER
The Nuffield Foundation is an independent charitable trust with a mission to advance social well-being. It funds and undertakes rigorous research, encourages innovation and supports the use of sound evidence to inform social and economic policy, and improve people’s lives. The Nuffield Foundation is the founder and co-funder of the Nuffield Council on Bioethics, the Ada Lovelace Institute and the Nuffield Family Justice Observatory. This project has been funded by the Nuffield Foundation, but the views expressed are those of the authors and not necessarily the Foundation. Find out more at: www.nuffieldfoundation.org. Bluesky: @nuffieldfoundation.org, LinkedIn: Nuffield Foundation


